NASA presented the first SPHEREx panorama on December 18, 2025. Behind every direction on that map is a series of brightness measurements in the near infrared. These measurements yield galaxy spectra and maps of ice in Milky Way clouds. The team scheduled the release of first-year spectral cubes for November 2026. As of November 4, IRSA offers QR2 and QR3 spectral images, while the separate first-year release is still unannounced.
- The first panorama covers the entire sky. Its visible colors represent a small selection of the 102 infrared channels.
- In a spectral cube, two coordinates locate a patch of sky and the third selects a wavelength.
- In Cygnus X and the North America Nebula region, SPHEREx mapped absorption by water ice and other frozen molecules.
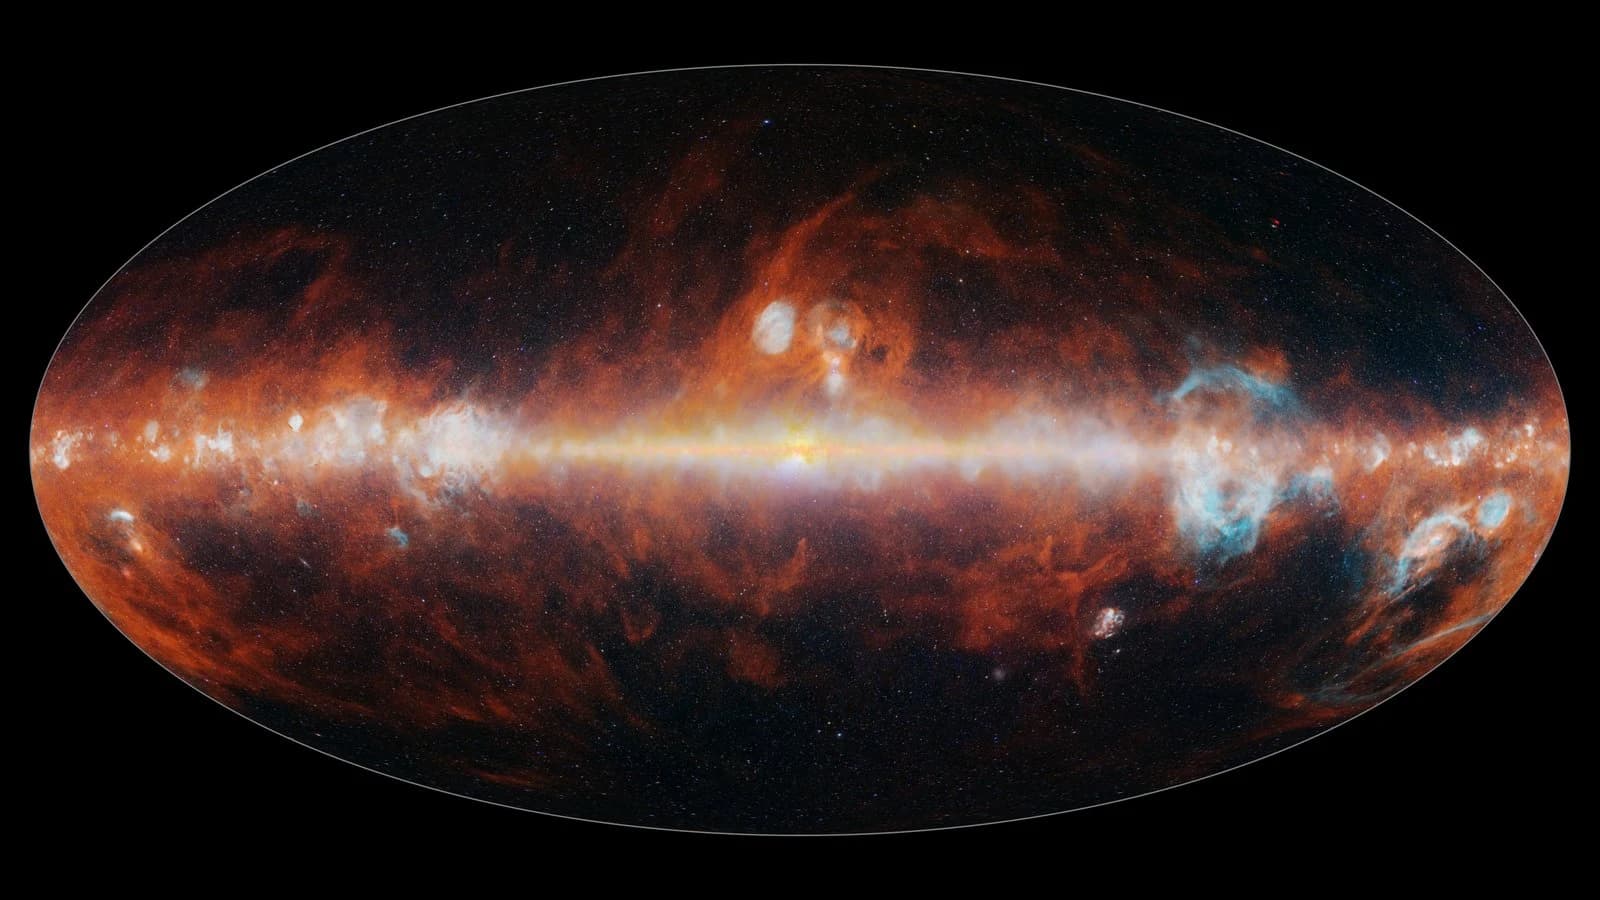
What the first SPHEREx panorama showed
SPHEREx began routine survey observations in May 2025. From polar Earth orbit, it images successive patches along a broad strip. The strip gradually shifts as Earth travels around the Sun. In about six months this strategy collects measurements from across the celestial sphere. The primary program calls for four passes so that combined maps can reach greater sensitivity.
The bright central band in the published mosaic is the Milky Way. Selected infrared channels were combined into a visible-color image. Red highlights dust emission, blue hues pick out features including hot hydrogen, and another set of channels shows stars. The full spectral data allow the same coordinates to be viewed separately in each band.
Which data are available in November 2026
The Caltech team scheduled first-year all-sky spectral cubes and reprocessed calibrated images for November. The schedule gives the month. As of November 4, 2026, IRSA’s release page and news feed list public QR2 and QR3 spectral images. Neither section yet confirms the separate release of first-year cubes and images.
QR3 became available in September 2026. It improved calibrations, including the model of how light from a point source spreads across pixels. The public images can already be used to extract a spectrum at specified coordinates or assemble a mosaic for a chosen region. That cube is built to the user’s specifications. The first-year release is planned as a separate set of survey products.
How the filters provide 102 spectral channels
The instrument works from 0.75 to 5 micrometers. Filters in front of six detectors transmit wavelengths that change gradually across their surface. When the telescope shifts its pointing slightly, light from the same star reaches a different part of the filter. A series of pointings yields brightness measurements of that star at different wavelengths.
The team uses a standard set of 102 channels to combine measurements from different pointings into a common map. That requires accounting for image uncertainties, uneven coverage, and foreground light. Zodiacal light from Solar System dust, for instance, adds a glow in front of distant objects. Its contribution matters when mapping faint diffuse emission.
From wavelength layers to a three-dimensional galaxy map
A spectral cube resembles a stack of maps of the same patch of sky. Each layer records brightness in a different channel. Reading through the layers at one point gives the spectrum in that direction. The depth of the stack corresponds to wavelength. Light from nearby and distant objects can still fall in the same part of an image.
A three-dimensional galaxy map requires a separate redshift estimate. Recognizable parts of a distant galaxy’s spectrum appear at longer wavelengths. The shift helps estimate distance within a cosmological model. Researchers can then study how large numbers of galaxies cluster in space. These distribution statistics let them test models of the early universe.
How SPHEREx maps interstellar ice
In cold molecular clouds, ice coatings form on dust grains. When starlight or diffuse Galactic light passes through a cloud, some of it is absorbed. Water ice leaves a broad feature near 3 micrometers. Carbon dioxide and carbon monoxide ices have features near 4.27 and 4.67 micrometers. Measuring the depth of these features lets researchers trace the distribution of material.
In April 2026, Joseph Hora’s team published ice maps of Cygnus X and the North America Nebula region. The mapped regions span hundreds of light-years. Water and carbon dioxide ice signatures trace dense, cold areas, and the relative strengths of their features vary from one line of sight to another. These measurements help show where material accumulates for future stars and planetary systems.
How the SPHEREx survey differs from Webb and Roman
James Webb obtains detailed spectra of selected targets and resolves finer spectral features. SPHEREx collects spectra across the celestial sphere. For ice studies these approaches complement each other. A detailed spectrum helps identify material along a particular line of sight, while a survey shows how the same signatures are distributed across a cloud.
The Roman telescope is designed for large surveys of selected fields. Its program includes wide extragalactic imaging and repeated observations of the Milky Way bulge. SPHEREx’s defining task is a near-infrared spectral survey of the entire sky. Sky coverage and the kind of data needed for a particular task are therefore the most useful points of comparison.
Sources
- NASA JPL on the completion of the first SPHEREx map
- NASA JPL, the first SPHEREx panorama PIA26600
- Caltech, the SPHEREx data delivery schedule
- NASA/IPAC IRSA, available SPHEREx releases and tools
- NASA/IPAC IRSA, archive release announcements
- IPAC, spectral image and calibration documentation
- Caltech, survey strategy and variable filters
- Cukierman and colleagues on making spectral maps
- NASA JPL on maps of interstellar ice
- Hora and colleagues on ice absorption maps
- NASA, Roman’s core survey programs
Questions and answers
Why is the SPHEREx map described as having 102 colors?
Here, a color means a band of infrared wavelengths. Several bands are represented in visible colors for publication. Scientific measurements are stored by channel.
Have the first-year SPHEREx data been released?
As of November 4, 2026, IRSA confirms public QR2 and QR3 images. The first-year spectral cubes and reprocessed images are scheduled for November. The archive sections checked have yet to announce that release separately.
Where can I see the map and find scientific images?
The finished panorama is published on JPL’s website. Spectral images and processing tools are available through the NASA/IPAC IRSA archive. Both are linked in the sources.
Where did the telescope detect interstellar ice?
The published ice maps cover Cygnus X and the North America Nebula region. The researchers identified water, carbon dioxide, and carbon monoxide ices on dust grains from their absorption features.