How to find a dark-sky location
A light pollution map helps compare the effects of artificial lighting in different places. A modeled sky-brightness layer is more useful for finding dark skies than an ordinary nighttime image of cities. You then need to check conditions for the particular night: a map cannot replace a weather forecast or the Moon's position.
Start with two or three accessible sites, rather than the most remote point. Compare them at the same zoom level and on the same layer. The goal is to find a location suitable for your chosen object, with an open sky and a clear access route. Links to the map and primary sources are collected at the bottom of the article.
How to use Lightpollutionmap.info
Open Lightpollutionmap.info and find a settlement or enter coordinates. In the Map layers menu, select Sky brightness: this layer shows modeled sky brightness. VIIRS is used to compare the light sources themselves, showing a satellite-based measure of radiation from the surface. It answers a different question, so equally dark colors on the two layers cannot be interpreted in the same way.
Check the year and legend, then click your chosen site. The SQM value in mag/arcsec² describes the brightness of a patch of sky: a larger number means a darker background. Record the layer, year, coordinates, and value. Zooming in does not turn the model into a measurement of every clearing: a single streetlight or new construction may change what you experience on site.
Why this is not a real-time map
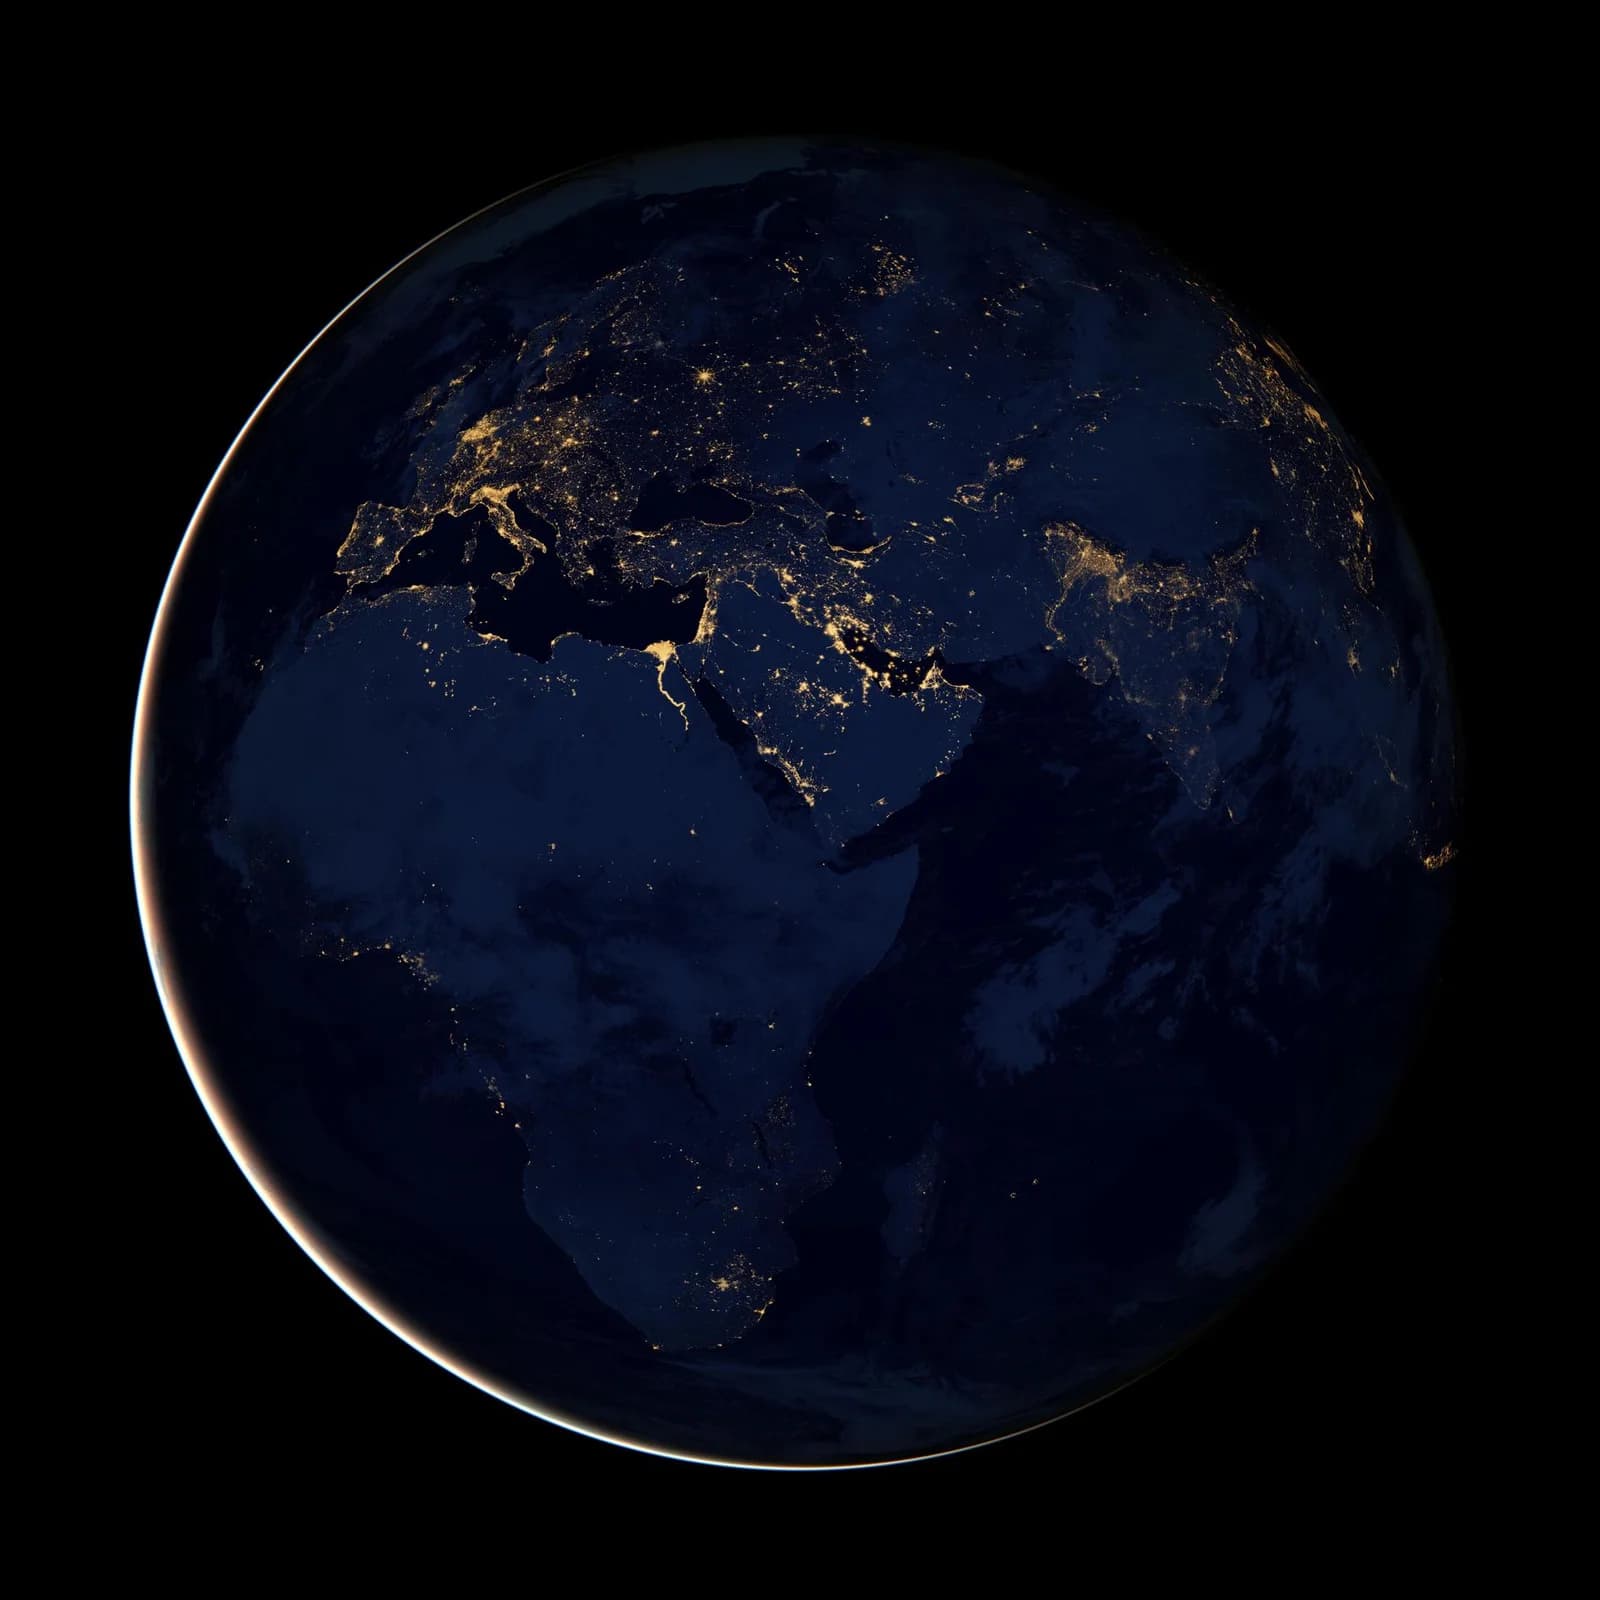
A nighttime satellite image shows light traveling upward. To estimate the skyglow seen by someone on the ground, researchers model how light scatters through the atmosphere. A color-coded atlas is therefore a calculation, rather than a photograph of tonight's sky above your home. Atlas author David Lorenz explicitly distinguishes a model of zenith brightness from an observer's assessment of the whole sky.
Check the source label. For example, when this article was prepared, Lorenz's atlas used satellite data from 2025, while Lightpollutionmap.info also offered the historical World Atlas 2015. An old layer's name does not mean that all current maps use 2015 data. Weather, moonlight, and new local lights need to be checked separately.
The Bortle scale and SQM: what the numbers mean
John Bortle proposed a nine-class scale, ranging from very dark class 1 skies to bright inner-city class 9 skies. It considers the visibility of the Milky Way and faint objects, glow along the horizon, and other observable features. It is a way to describe conditions, rather than a promise that you will see a particular star regardless of your experience or atmospheric conditions.
SQM is a numerical estimate of sky brightness, measured with an instrument or calculated in a model. It is not equivalent to a Bortle class: a single measurement at the zenith does not describe the whole horizon. An automatically assigned class beside a map point is useful as a rough guide. Compare locations within one system, then make your final assessment under the real sky.
How to compare two observing sites
First decide where you will be looking. Set your location and time in a sky-map application, then find your target's direction and altitude. If the relevant region is low, woodland or buildings may block it even at a very dark site. Exploring bright planets or the Moon requires different levels of darkness from searching for a faint galaxy.
Imagine two hypothetical options. The first is darker in the model, but the road is unverified and trees block the horizon you need. The second is slightly brighter, but accessible and open in the right direction. For a particular evening, the second may be more useful. No fixed distance from a city guarantees dark skies: the distribution of lights and local conditions matter. Check the site on a daytime map and confirm access in advance.
The Geminids offer a practical reason to compare sites. This December meteor shower benefits from a broad, open view: a secluded yard with a narrow gap between buildings may be less useful than a slightly brighter field. Complement your light-pollution map with checks of the view, clouds and moonlight for the chosen night.
When to go: twilight, the Moon, and weather
Sunset does not mean it is completely dark. Evening astronomical twilight ends when the center of the Sun is 18 degrees below the horizon. For faint nebulae and galaxies, it helps to plan observations after that point. Check a local calculation for your chosen date: twilight's duration depends on latitude and season.
The Moon can hide faint details even far from a city. Check not only its phase but also its rising and setting times: a dark window may occur before moonrise or after moonset. Then assess hourly cloud cover and atmospheric transparency. A site with an appealing map color is useless if clouds cover your target during the chosen hours.
For example, plan for the 2026 Leonids after the waxing Moon sets, rather than relying only on a site’s dark color on the map. For Moscow, USNO gives moonset at about 23:40 on November 17, leaving predawn hours as Leo climbs higher. Recalculate for another city: an identical light-pollution estimate does not imply an identical moonlight window.
What to check before setting out
Save the coordinates of your main and backup sites, your route, and a sky map. Check the forecast again before leaving, prepare clothing for the nighttime temperature, and make sure access is permitted. Avoid stopping on the shoulder of a busy road: headlights disrupt observing, and you need a safe place to stop.
At the site, give your eyes about 20–30 minutes to adapt to the darkness. Put away bright screens and white flashlights; use a dim red light when necessary. Record the date, time, cloud cover, Moon's position, and interfering lights. A log helps explain why the same location reveals a different sky on different nights and lets you plan your next trip more accurately.
Sources
- Lightpollutionmap.info: guidance on VIIRS and Sky brightness layers and model limitations
- David Lorenz: Light Pollution Atlas: 2025 data and differences from the Bortle scale
- John E. Bortle: Introducing the Bortle Dark-Sky Scale, Sky & Telescope, February 2001
- NASA: Skywatching FAQ: choosing a site, light pollution, and sky maps
- NOAA / National Weather Service: Definitions of Twilight
- National Park Service: Stargazing 101: weather, the Moon, and dark adaptation
- Tool: interactive light pollution map at Lightpollutionmap.info
- NASA — watching the Geminids and choosing a site
- USNO — the Moon in Moscow on November 17, 2026, UTC+3
- NASA — Leonid origins, speed and observing
Questions and answers
Which light pollution map should I try first?
Lightpollutionmap.info lets you choose layers and years. Start with Sky brightness to compare sky darkness; VIIRS shows radiation from sources on the ground. Open the legend for your chosen layer.
Where can I find a light pollution map of Russia?
Global maps cover Russia. Find your city or enter coordinates, then compare several sites. Check the Moon, twilight, and weather separately for your chosen night.
Can I see the Milky Way in a green zone?
A color alone does not guarantee this, because legends differ. The season, position of the Milky Way, atmospheric transparency, and moonlight all matter. Use the map to shortlist locations, rather than as a promise of results.
How many kilometers should I travel from a city?
There is no universal number. Compare specific locations, surrounding light sources, and the openness of the horizon you need. An accessible site with suitable conditions is more useful than a distant, unverified one.